Predicted Performance Data
Initially the pump’s predicted performance is based on the standard affinity laws.
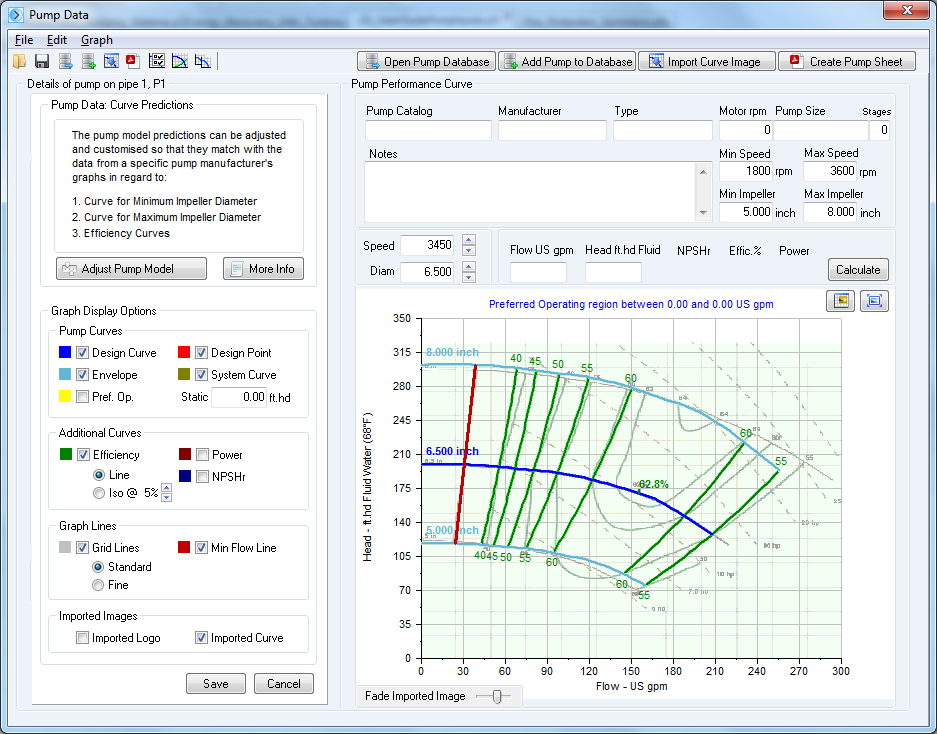
Figure 86 Pump Initial Affinity Predictions
In many cases the predicted performance curves will agree closely with a pump manufacturer’s published graph, however for more accurate modelling of pump performance, it may be necessary to adjust the predicted shut-off head, and adjust the curvature & efficiency points for the predicted curves at the maximum and minimum impeller diameters.
The ‘Adjust Pump Model’ button provides access to functionality that allows customization of the predicted pump performance curves.

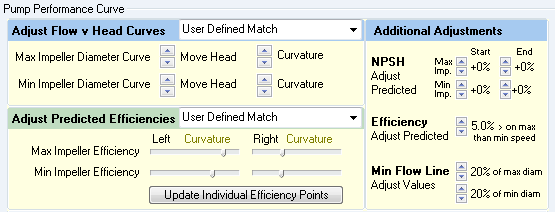
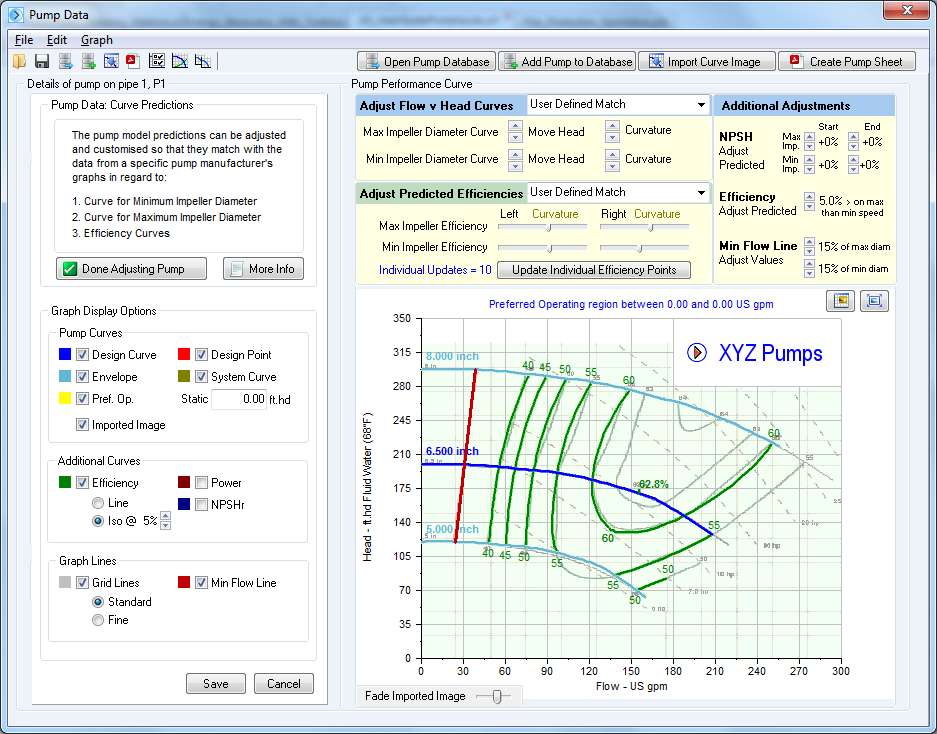
Figure 87 Pump Performance Curve
The ‘Adjust Flow v Head’ options can be used to adjust the shut-off head & the rate of curvature for the minimum & maximum impeller diameter curves, to match them to the published performance data.
The ‘Adjust Predicted Efficiencies’ options allow the predicted efficiency values to be modified to match the published performance data.
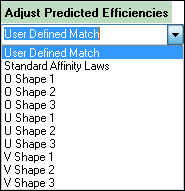
Figure 88 Adjust Predicted Efficiencies
A number of iso efficiency ‘shapes’ are pre-defined in the dropdown options.
These choices provide an easy method of selecting an initial starting position for the iso efficiency map. Once a further adjustment has been made to the data, the iso efficiency shape selection type will become user defined match.
The slide adjustments allow the curvature of groups of iso efficiency lines to be moved as a block to the left or right. The BEP (best efficiency point) on the base data performance curve is used to divide the performance graph into different areas.
These adjustments should be used to match the efficiency points on the maximum and minimum impeller performance curves.
Final adjustment of individual efficiency points on the maximum and minimum performance curves can be made (if necessary) by selecting the ‘Update Individual Efficiency Points’ option.
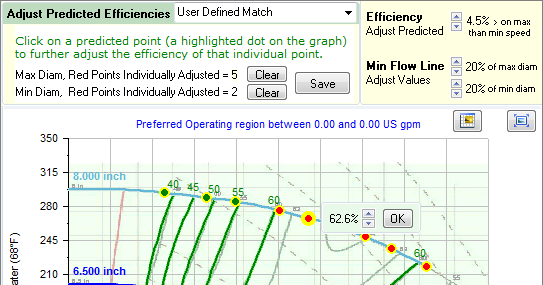
Figure 89 Adjust Individual Efficiency Points
To adjust an individual efficiency point, click on a ‘Green’ point on the performance curves and use the up/down adjustment to set the efficiency value for the point.
The point will be colored ‘Red’ to indicate an adjustment has been made.
These adjustments may be reset by clicking the ‘Clear’ button
Additional adjustments for NPSHr and efficiency predictions at different operating speeds can also be made in order that the performance of the pump across a range of speeds and impeller diameters is accurately mapped.
The efficiency of a centrifugal pump generally reduces as the operating speed is reduced. It can be seen from many pump manufacturers performance graphs that a speed reduction of 50% will reduce the pump efficiency by around 5%.
When a pump is required to operate at low flow rates and/or in low efficiency areas a centrifugal pump may not perform as expected. Operation in these areas may not be recommended.
The minimum flow line can be set as a percentage of the maximum flow on a particular curve.
Pipe Flow Expert will not include pumps which operate below the minimum flow line setting when searching the pump database for suitable pumps to match a particular flow rate.
Once a pump has been modelled to match the published data, the complete pump model can be saved to the searchable Pump Database for future use. A pump data sheet in PDF format can also be produced. This shows detailed information about the pump and provides a scalable high resolution image of the pump performance graph.

The adjusted pump graph can be used in a Pipe Flow Expert system to model the complete performance of the pump over a range of speeds and impeller sizes.
A logo image can also be added to the pump graph to assist with identification of the pump.