Import Pump Curve Image
Pipe Flow Expert provides functionally to import and create a mathematical pump model which allows adjustment of the pump performance for different operating speeds & impeller diameters.
To import a pump curve image and plot Flow v Head points:
Click on a pump in a Pipe Flow Expert system to open the Pump Data screen
Click the ‘Import Curve Image’ button to open the import screen.

Follow these steps to create a mathematical model of the pump performance.
Step 1:
Import an image of a pump manufacturer’s performance graph

Figure 76 Import Curve Image Step 1
Step 2:
Set the range of the X axis (flow) & the flow units.
Now click the start & end points of the X axis on the imported image.

Figure 77 Import Curve Image Step 2
Step 3:
Set the range of the Y axis (head) & the head units.
Now click the start & end points of the Y axis on the imported image.

Figure 78 Import Curve Image Step 3
Step 4:
Click on the ‘Select Points on Curve’ button.
Click the shut off head point at zero flow for the chosen curve.
A red cross shows the point that has been selected.

Figure 79 Import Curve Image Step 4
Step 5:
Click additional points on the chosen pump curve
(in order to define it across the flow range of the pump).
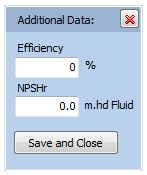
Enter the Efficiency & NPSHr associated with each operating point.
Repeat for up to 10 points to build the pump model.

Figure 80 Import Curve Image Step 5
Step 6:
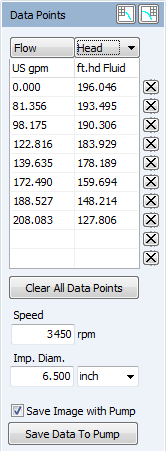
This input table can be moved around the screen in order to allow viewing of any parts of the pump curve which may be obscured. Click on the header bar and drag it to a new position as required.
The table shows Flow, Head, Efficiency and NPSHr entries.
Select from the heading drop down to switch between display of Head, Efficiency and NPSHr values. Entries can be updated and deleted as required.

Figure 81 Import Curve Image Step 6
Step 7:
Enter the pump speed, impeller diameter and specify the impeller units.
Click ‘Save Data to Pump’ to return to the main Pump Screen.
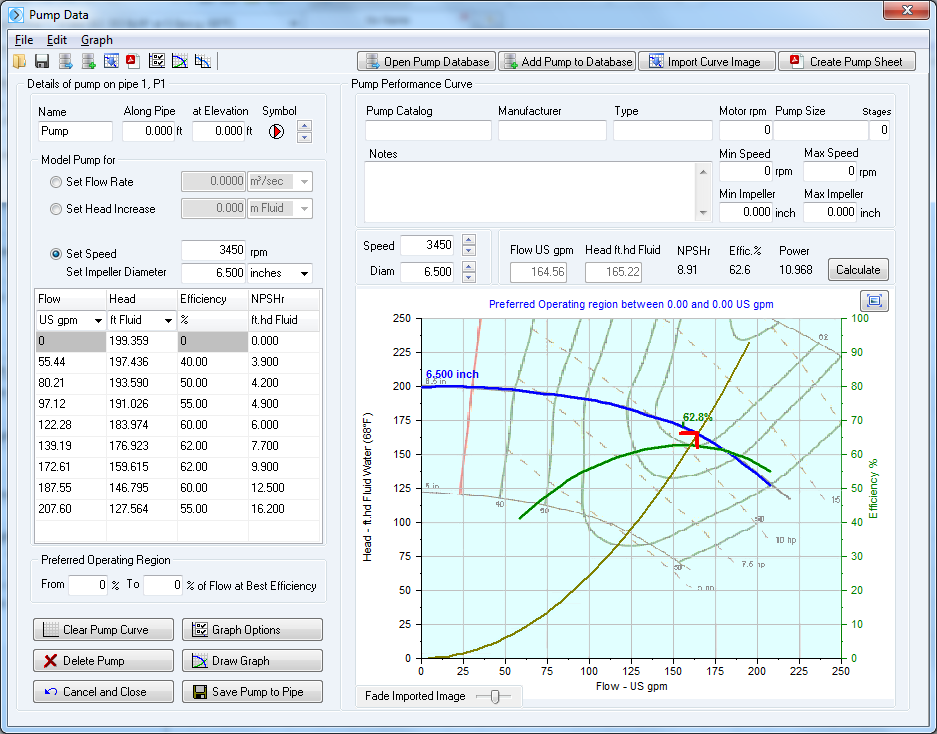
The imported data produces a pump graph with a flow versus head performance curve. This simple pump object can be ‘Saved’ on to a pipe within a system.

Figure 82 Pump Data for Saving
The Pump Catalog, Manufacturer, Pump Type, Motor rpm, Pump Size, Stages and Notes fields should be filled in before saving the pump to a system or saving to the pump database.
This supplementary information will be included on the Pump Data Sheet PDF and on the system’s Results PDF Report when these documents are produced.
The supplementary information will also be available in the future when pump data is loaded from the pump database.

Figure 83 Simple Pump Graph from imported points
When a system is solved the pump’s operating point will be calculated and the Flow Rate, Head, Efficiency and NPSHr values will be displayed together with shaft power.
A system curve can also be plotted through the operating point.
Note: If the static head in the system is not zero then the user can enter a static head value and the system curve will automatically redraw taking account of this. The software cannot automatically calculate a static head because if a network has many loops and paths then the static head would depend on which section and run of pipe was being considered. To change the static head, click on the Graph Options button and then enter the Static head under the checkbox for the system curve.
Further options are available for the modelling of predicted pump performance when changes in pump operating speed and variations to pump impeller diameters are applied. The following sections describe the use of these further options.

