Working with Pump Curve Graph
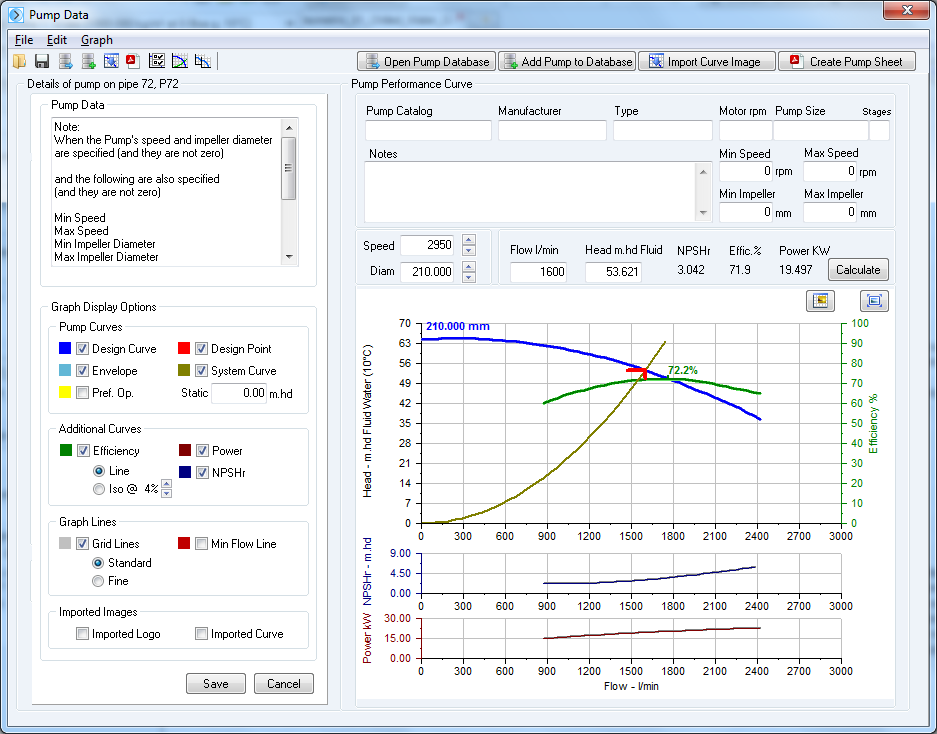
Once the data for a centrifugal pump has been added, you can view an interactive graphical representation of the data in the graph section of the Pump Data screen.
To view the Pump Curve Graph:
- Click on a pump in a Pipe Flow Expert system to open the Pump Data screen. Click the Draw Graph button to generate and display the Pump Curve graph.
- Click the Graph Options button to open the graph options screen. Select the check boxes for the elements you wish to be displayed on the graph.
- Clear the check boxes for the elements that you do not want displayed on the graph.
- When you select a check box, the element appears on the graph. When you clear a check box, the element is removed from the graph.
- To view the pump head, NPSHr, efficiency percentage and power for a specific flow rate, type the flow rate in the Flow field above the graph drawing.
- Click the Calculate button.

Figure 75 Pump Graph with NPSHr and Power
- The calculated pump head, NPSHr, efficiency percentage, and power for the entered flow rate are displayed, and the point is mapped on the Pump Curve graph. The design point is represented by a red marker on the graph.
- To view the flow rate, NPSHr, efficiency percentage and power for a specific head, type the pump head in the Head field above the graph drawing.
- Click the Calculate button.
- The calculated flow rate, NPSHr, efficiency percentage, and power for the entered pump head are displayed, and the point is mapped on the Pump Curve graph. The design point is represented by a red marker on the graph.
- A logo may be added to the pump graph. Click the Add Logo button on the pump graph area to load a logo image. Click the Expand button to view a larger graph
 .
.
- Any relevant notes may be added to the Notes field.
- The Pump Data screen menu provides options to:
- Save the pump data to a standalone pump file.
- Add the pump to the pump database.
- Open the graph options to allow selection of the items to be included on the graph.
- Copy the graph image.
- Create a PDF pump sheet with a high resolution performance graph.
- Further functionality allows the import of a scanned image of a manufacturer’s pump curve, plus modelling of performance predictions for changes in pump operating speed and variations in impeller diameters. The following sections describe the use of these further options.

