Viewing Individual Results
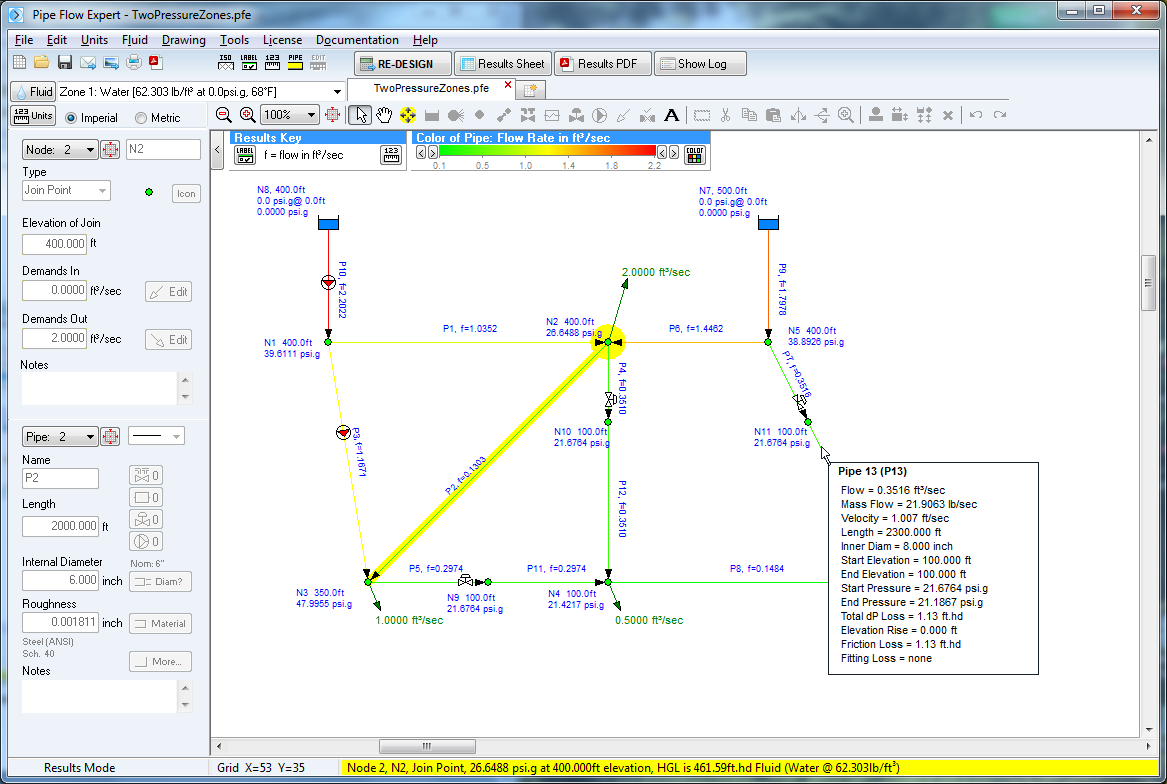
Items are highlighted by a left clicking with the mouse while hovering over an item on the drawing pane. Data for the highlighted item is displayed in the Hint pane.
In Results mode, when an item is selected the Hint pane is used to display information about the item, which can include flow rates, velocities, pressure drops, pressures at join points, head pressure (grade line), elevations of tanks and nodes, and fluid heads at specific points within the system.
Also in Results mode, when the cursor is moved over an item on the drawing, a pop-up panel appears that displays information about the item. When the cursor is moved away from the item the popup panel automatically disappears. This allows a user to inspect a large number of results for different parts of the system without having to continually click the mouse button.
The Results Popup Panel displays a variety of important results data, including:
- Volumetric Flow Rate
- Mass Flow Rate
- Velocity
- Pressure Loss
- Friction Loss
- Fitting Loss

Figure 33 View Individual Results
The Results drawing can be configured to display the pipes in various colors based on the value of a chosen category such as Flow Rate, Velocity, Friction Loss, Internal Diameter etc. The color gradient start and end point values may be adjusted to narrow the band over which the colors are displayed.

