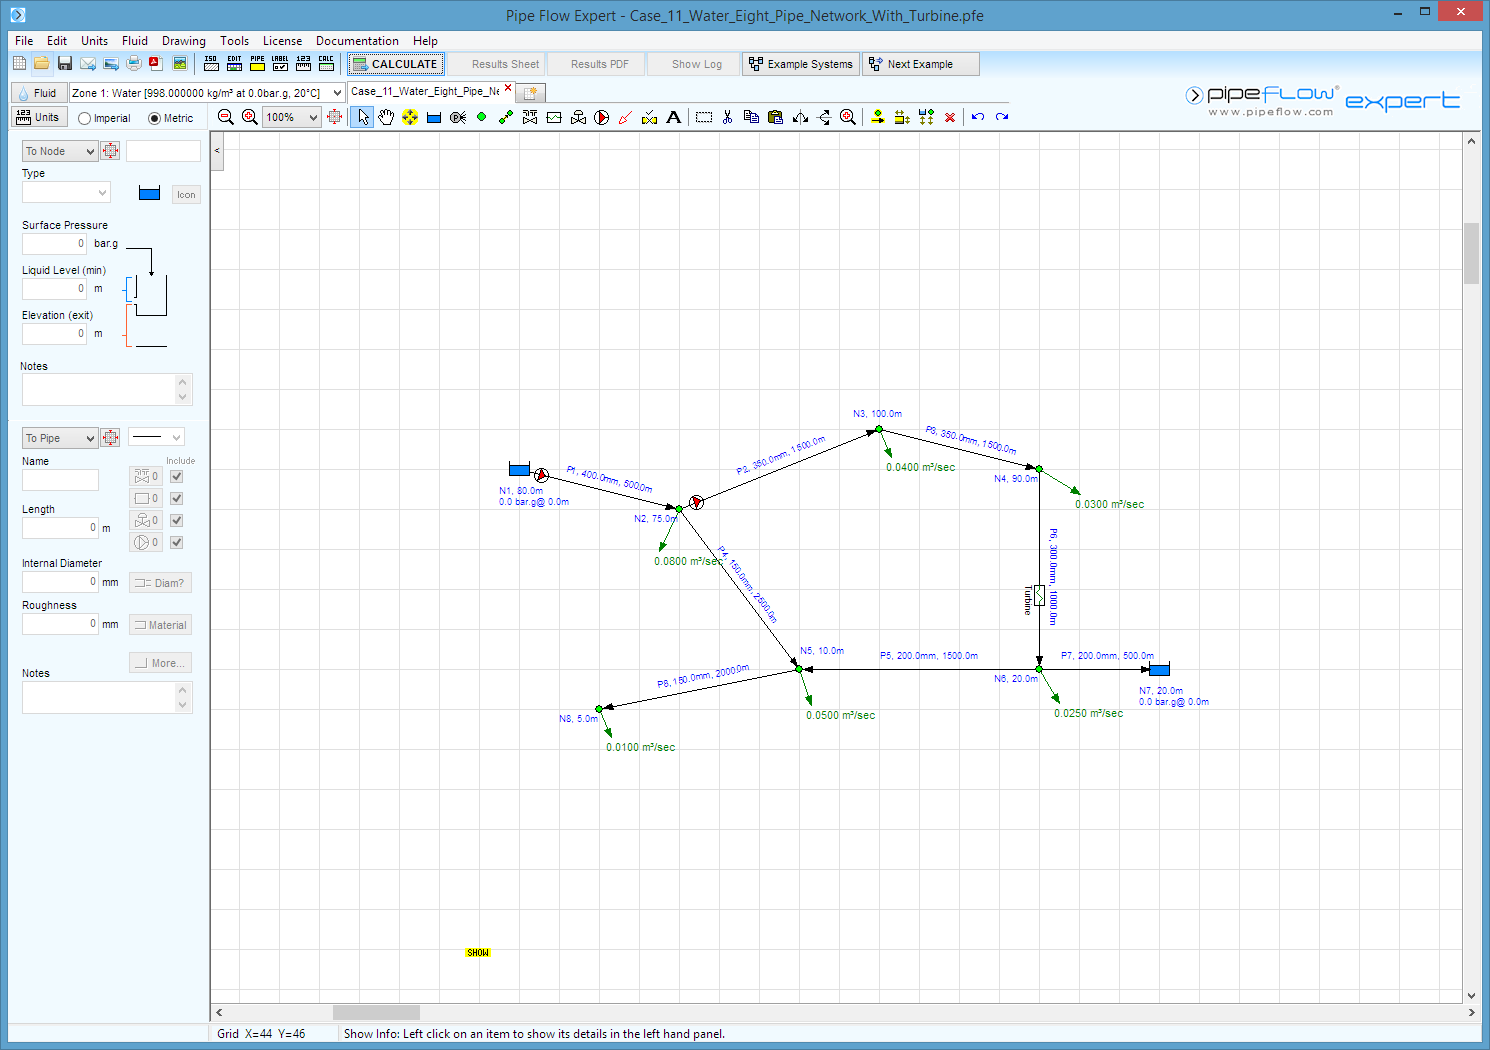
Case 11: Water - Eight Pipe Network with Two Pumps and a Turbine
Reference: Hydraulics of Pipeline Systems, 2000, CRC Press LLC, Bruce E. Larock, Rowland W. Jeppson, Gary Z. Watters, Page 115, Example problem 4.14
Pipe Flow Expert File: Case_11_Water_Eight_Pipe_Network_With_Turbine.pfe
Problem Description:
Water is pumped from a single source around a network of 8 interconnected pipes. A booster pump is used get the water over hills which are at a higher elevation than the source.
A turbine is placed in the system to recovery the extra head after the water has been moved over the hill crest. The network has one closed loops and one open loop.
1. Calculate the flow rate & head loss in each pipe.
2. Calculate the pressure and the hydraulic grade line at each node point.

Fluid Data: Water at 20° C (assumed).
Result Comparison:
|
Data Item |
Published data |
Pipe Flow Expert |
|
Data Item |
Published data |
Pipe Flow Expert |
|
Q1 Flow rate (m³/s) |
0.330 |
0.3309 |
|
Head Loss (m) |
8.78 |
8.800 |
|
Q2 Flow rate (m³/s) |
0.217 |
0.2180 |
|
Head Loss (m) |
23.02 |
23.128 |
|
Q3 Flow rate (m³/s |
0.177 |
0.1780 |
|
Head Loss (m) |
15.39 |
15.472 |
|
Q4 Flow rate (m³/s |
0.033 |
0.0330 |
|
Head Loss (m) |
76.55 |
76.346 |
|
Q5 Flow rate (m³/s |
0.027 |
0.0270 |
|
Head Loss (m) |
6.93 |
6.920 |
|
Q6 Flow rate (m³/s |
0.147 |
0.1480 |
|
Head Loss (m) |
15.87 |
15.984 |
|
Q7 Flow rate (m³/s |
0.095 |
0.0959 |
|
Head Loss (m) |
27.83 |
28.166 |
|
Q8 Flow rate (m³/s) |
0.010 |
0.0100 |
|
Head Loss (m) |
5.89 |
5.865 |
|
Data Item |
Published data |
Pipe Flow Expert |
|
Data Item |
Published data |
Pipe Flow Expert |
|
N1 Pressure (kPa) |
416.02 |
416.851 |
|
HGL (m) |
117.45 |
117.592 |
|
N2 Pressure (kPa) |
90.10 |
90.810 |
|
HGL (m) |
109.19 |
109.279 |
|
N3 Pressure (kPa) |
37.30 |
37.216 |
|
HGL (m) |
93.80 |
93.803 |
|
N4 Pressure (kPa) |
303.00 |
305.807 |
|
HGL (m) |
40.9 |
41.246 |
|
N5 Pressure (kPa) |
272.90 |
275.665 |
|
HGL (m) |
47.83 |
48.166 |
|
N6 Pressure (kPa) |
294.30 |
297.342 |
|
HGL (m) |
35.83 |
35.381 |
Commentary:
The published data and the calculated results compare well.
The reference contains a printing error on the network diagram:
The outflow from node 4 is shown as 0.025 m³/s the calculation input table shows a value of 0.050 m³/s.
The outflow from node 5 is shown as 0.050 m³/s the calculation input table shows a value of 0.025 m³/s.
The Pipe Flow Expert results are based on outflows from node 4 and node 5 as shown in the calculation input table.

