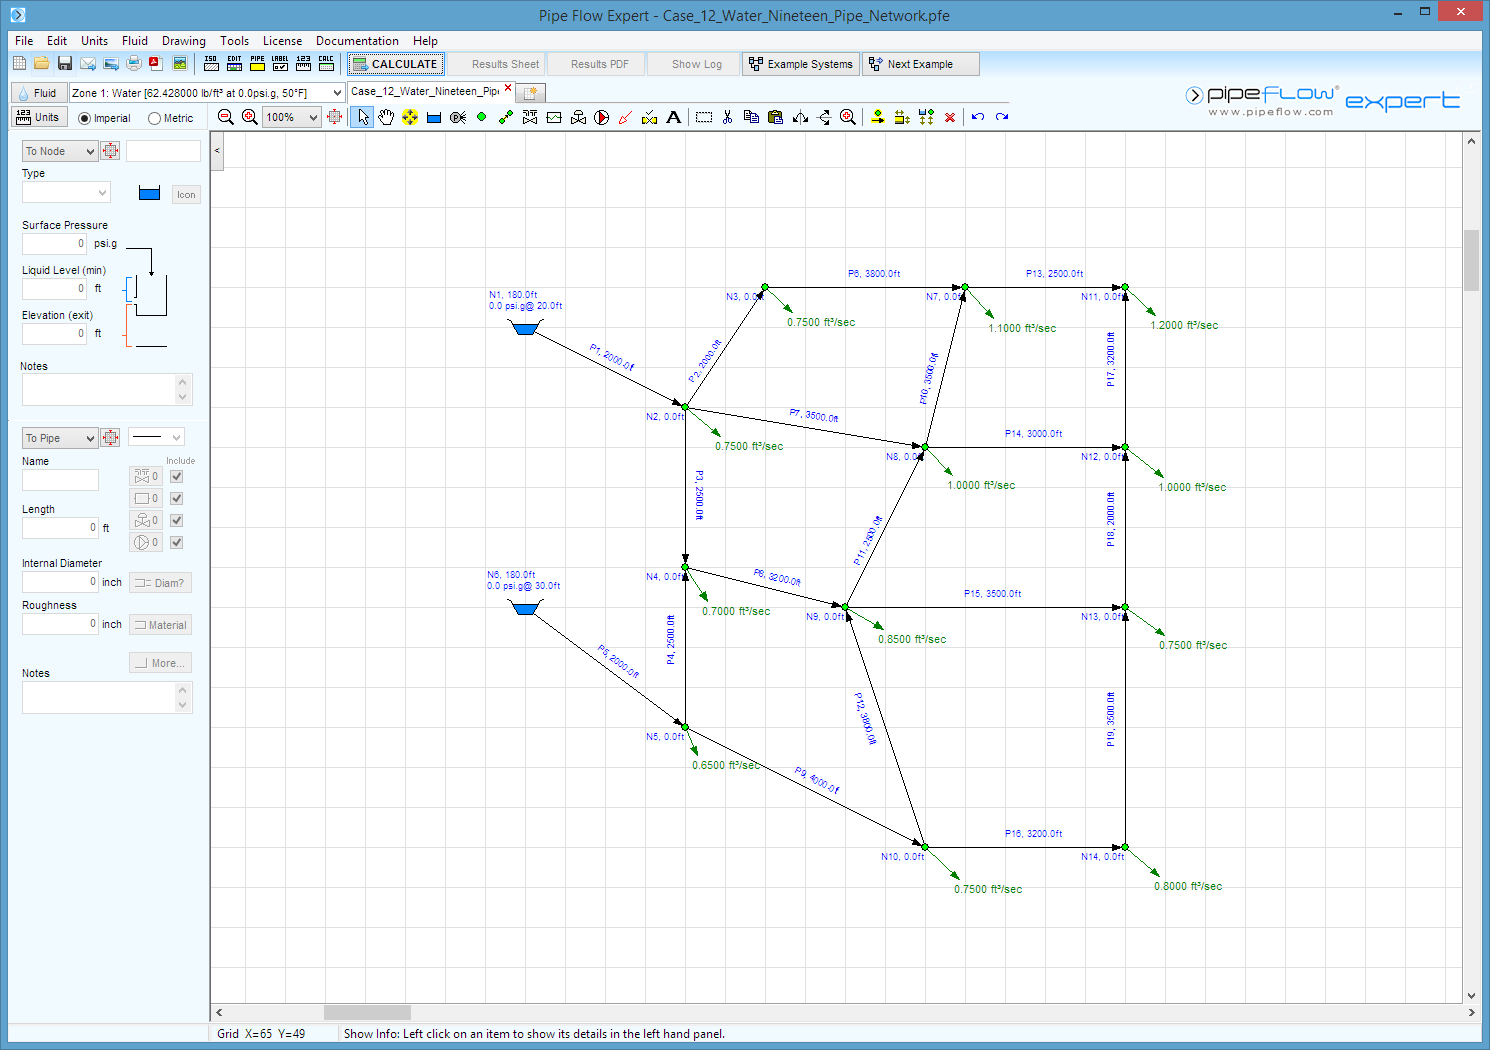
Case 12: Water - Nineteen Pipe Network
Reference: Hydraulics of Pipeline Systems, 2000, CRC Press LLC, Bruce E. Larock, Rowland W. Jeppson, Gary Z. Watters, Page 423, Example problem 12.3.2
Pipe Flow Expert File: Case_12_Water_Nineteen_Pipe_Network.pfe
Problem Description:
Water is supplied from two reservoirs to a nineteen pipe network. The pipes are connected at twelve node points.
Out flows from the network occur at each node point.
Find the flow rate and head loss for each pipe.
Find the pressure at each node point.

Fluid Data: Water at 50° F (assumed).
Result Comparison:
|
Pipe |
Published Flow (ft³/s) |
Pipe Flow Expert (ft³/s) |
|
Pipe |
Published Head Loss (ft) |
Pipe Flow Expert Head Loss (ft) |
|
P 1 |
5.30 |
5.2999 |
|
P 1 |
24.26 |
24.28 |
|
P 2 |
2.17 |
2.1717 |
|
P 2 |
10.96 |
10.96 |
|
P 3 |
0.41 |
0.4062 |
|
P 3 |
0.60 |
0.60 |
|
P 4 |
2.13 |
2.1287 |
|
P 4 |
13.19 |
13.19 |
|
P 5 |
5.00 |
5.0001 |
|
P 5 |
21.67 |
21.68 |
|
P 6 |
1.42 |
1.4217 |
|
P 6 |
9.29 |
9.29 |
|
P 7 |
1.97 |
1.9720 |
|
P 7 |
15.95 |
15.95 |
|
P 8 |
1.83 |
1.8349 |
|
P 8 |
12.70 |
12.71 |
|
P 9 |
2.22 |
2.2214 |
|
P 9 |
22.89 |
22.90 |
|
P 10 |
0.55 |
0.5450 |
|
P 10 |
4.30 |
4.30 |
|
P 11 |
0.50 |
0.5028 |
|
P 11 |
2.65 |
2.65 |
|
P 12 |
0.43 |
0.4291 |
|
P 12 |
3.00 |
3.00 |
|
P 13 |
0.87 |
0.8667 |
|
P 13 |
7.34 |
7.34 |
|
P 14 |
0.93 |
0.9298 |
|
P 14 |
10.06 |
10.06 |
|
P 15 |
0.91 |
0.9112 |
|
P 15 |
11.29 |
11.30 |
|
P 16 |
1.04 |
1.0423 |
|
P 16 |
13.32 |
13.33 |
|
P 17 |
0.33 |
0.3333 |
|
P 17 |
1.59 |
1.59 |
|
P 18 |
0.40 |
0.4035 |
|
P 18 |
1.41 |
1.41 |
|
P 19 |
0.24 |
0.2423 |
|
P 19 |
0.97 |
0.97 |
|
Node |
Published Press. (lb/in²) |
Pipe Flow Expert (lb/in²) |
|
Node |
Published Press. (lb/in²) |
Pipe Flow Expert (lb/in²) |
|
N1 |
n/a |
n/a |
|
N8 |
69.24 |
69.2468 |
|
N2 |
76.15 |
76.1808 |
|
N9 |
70.39 |
70.4121 |
|
N3 |
71.40 |
71.4275 |
|
N10 |
71.69 |
71.7123 |
|
N4 |
75.89 |
75.9223 |
|
N11 |
64.20 |
64.2159 |
|
N5 |
81.61 |
81.6406 |
|
N12 |
64.89 |
64.9034 |
|
N6 |
n/a |
n/a |
|
N13 |
65.50 |
65.5142 |
|
N7 |
67.38 |
67.3985 |
|
N14 |
65.92 |
65.9343 |
Commentary:
The published data and the calculated results compare well.

