Results Colors
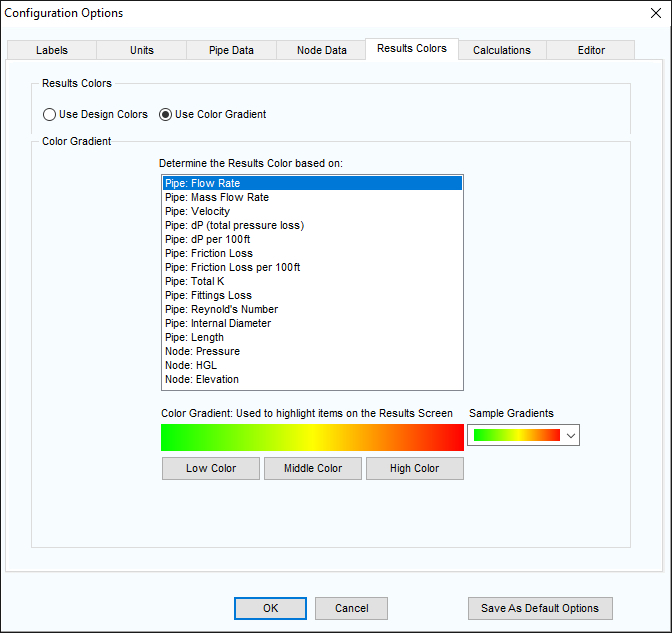
The results screen can display pipes and nodes from the solved network using a color gradient to highlight the pipes or nodes based on the result value for a chosen calculation category.

Figure 45 Configuration Options – Results Colors Tab
- Click the Color button,
 , on Results Screen Color Key, to open the Results Colors tab of the Configuration Options screen.
- Select a calculation category to be display in color on the Results screen.
- Choose a color gradient from the drop down of sample gradients, or use the Low, Middle and High color buttons to create your own color gradient.
- Click OK to update the drawing pane.

