Case 54: Water - Sharp-edged Orifice Loss Coefficient in a Transition
Reference: Pipe Flow – A Practical and Comprehensive Guide, 2012, Publisher Wiley, Donald C. Rennels, Hobart M. Hudson, Chapter 13, Page 146
Pipe Flow Expert File: Case_54_Water_Sharp_Edged_Orifice_Transition_Section.pfe
Problem Description:
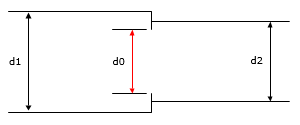
A transition section of pipe contains a sharp-edged single-hole orifice. The orifice diameter to upstream pipe diameter ratio is specified as d0/d1. The orifice diameter to downstream pipe diameter ratio is specified as d0/d2.

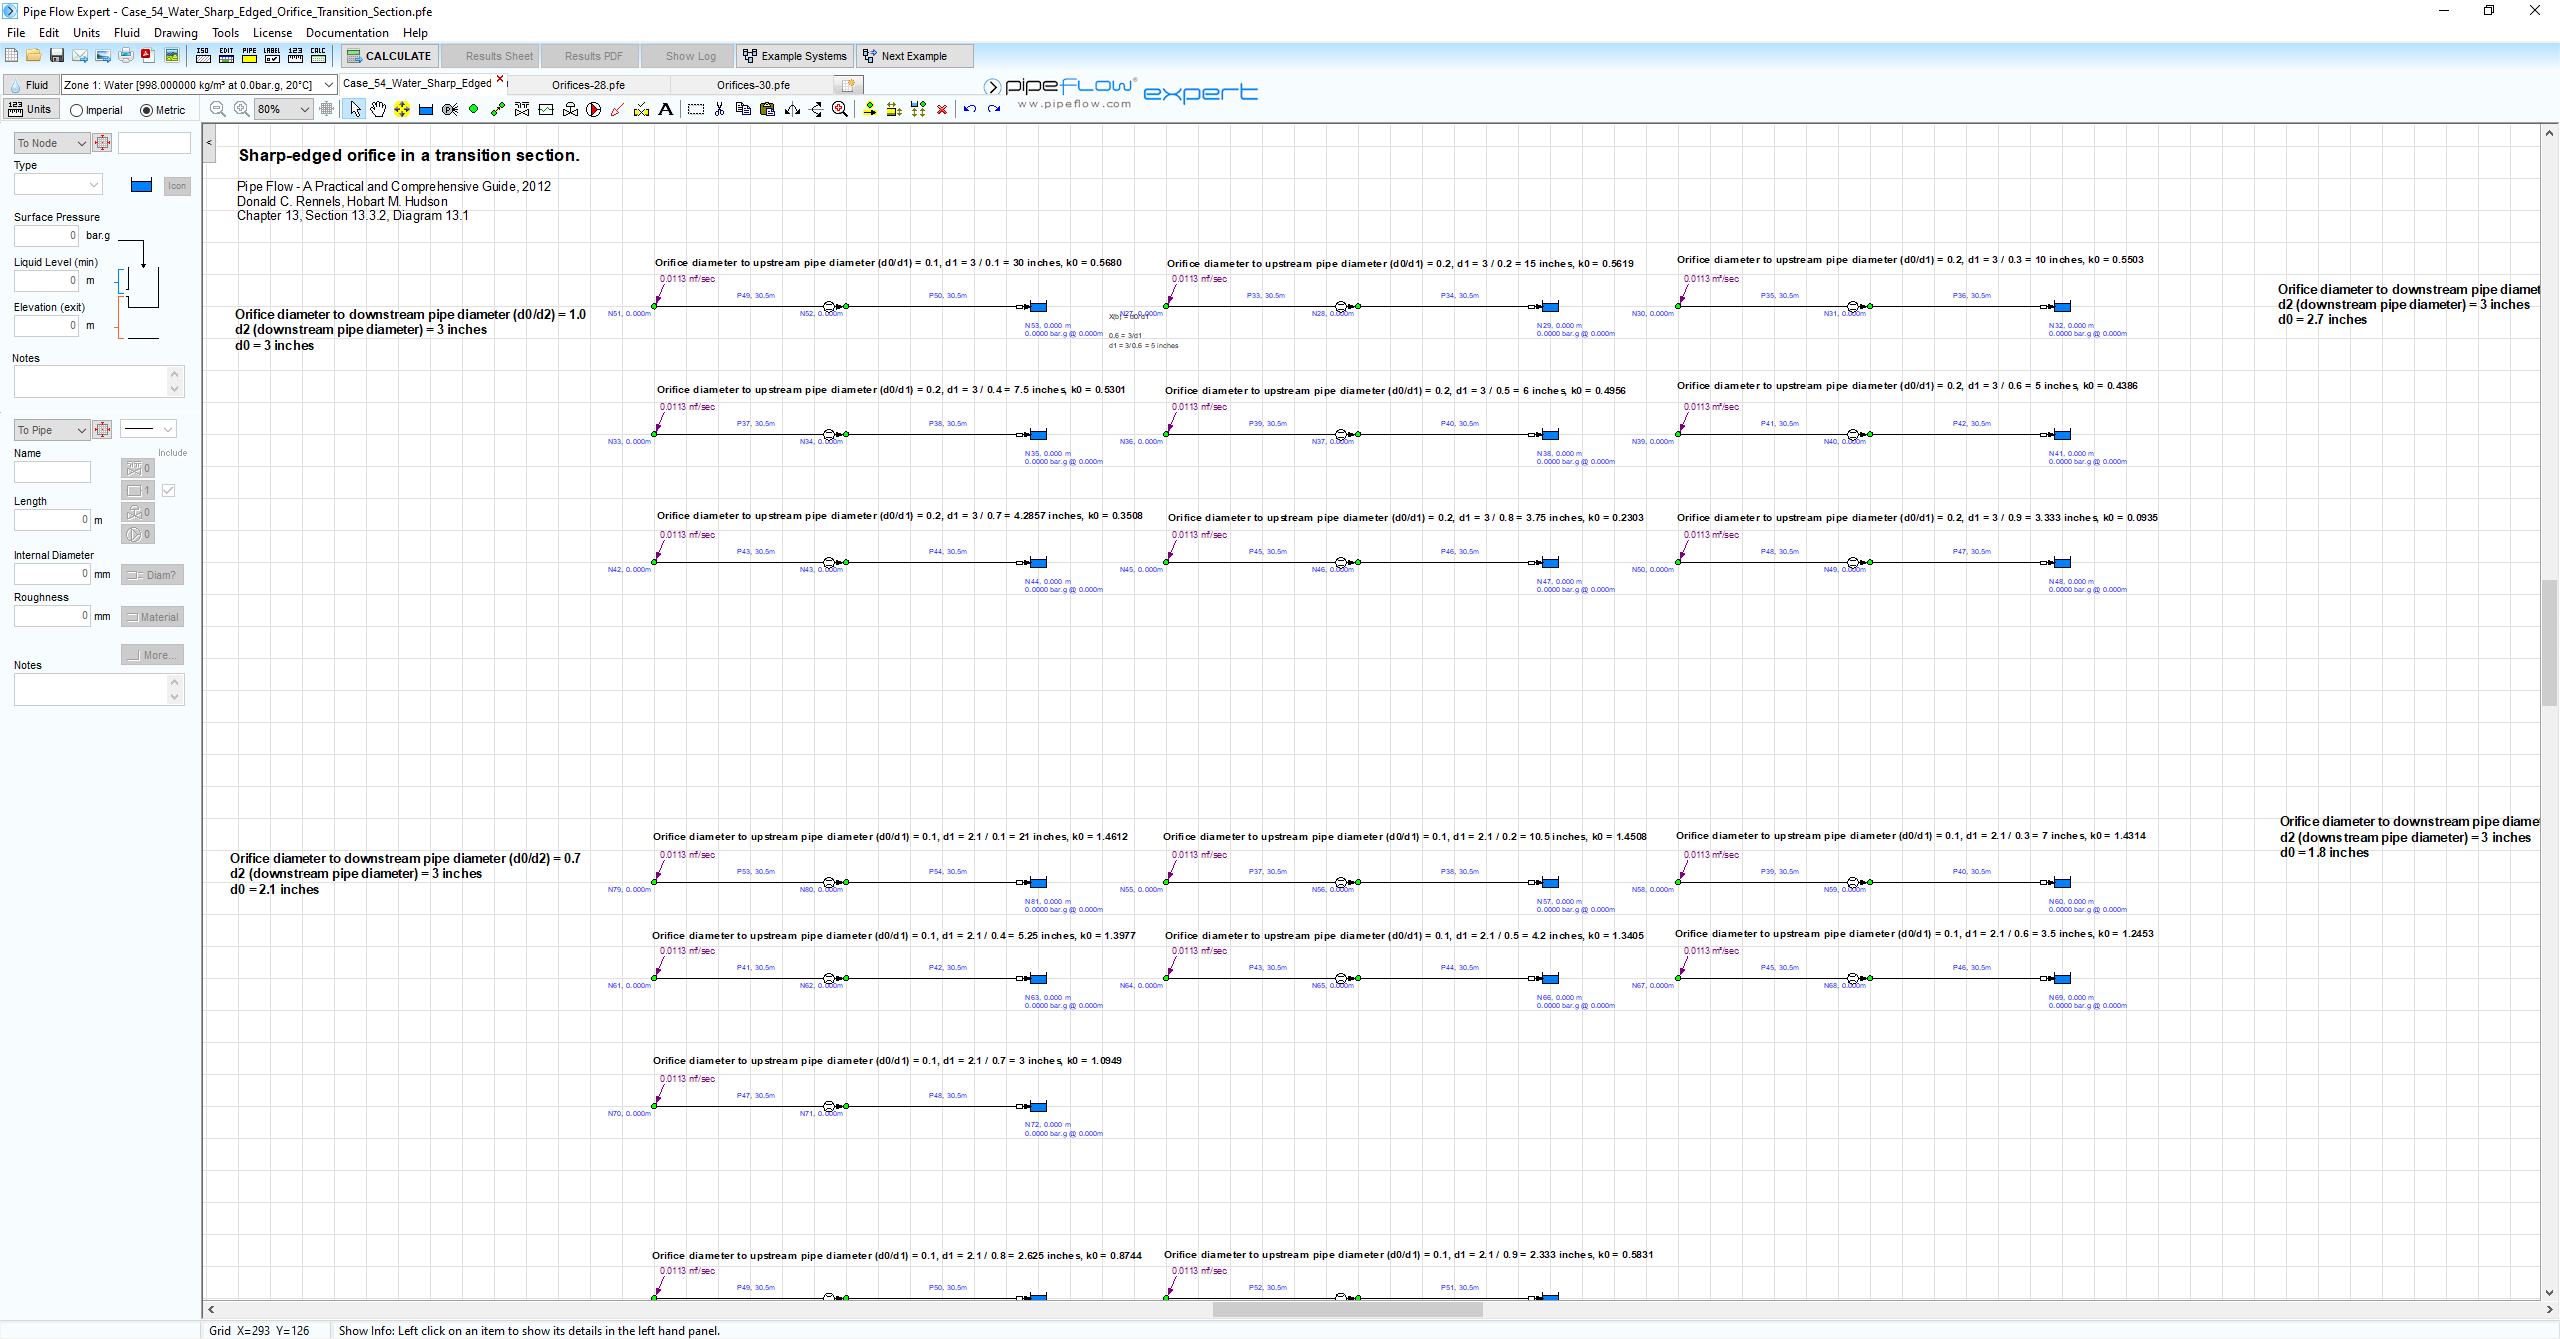
Use different orifice diameter to pipe diameter ratios, for both d0/d1 and d0/d2 to compare the calculated orifice loss coefficient (k0) to published results.
The published data for comparison uses the following calculation method:
Donald C. Rennels, Hobart M. Hudson, Equation 13.5.

Pipe Flow Expert Parameters:
Fluid Data: Water at, 68 °F
Ninety individual systems, each with inflow demands of 0.4 ft3/sec, were used to model a range of orifice diameter to upstream diameter ratios (d0/d1) over a set of orifice diameter / downstream diameter ratios (d0/d2).
Result Comparison:
Pipe Flow Expert Calculated Results and Published Graph Readings of Orifice Loss Coefficient (k0):
|
Orifice Diameter / Upstream Diameter (d0/d1) |
Orifice Diameter / Downstream Pipe Diameter (d0/d2) |
Donald C. Rennels, Hobart M. Hudson (k0) |
Pipe Flow Expert (k0) |
Transition Type |
|
0.1 |
1.0 |
0.5680 |
0.5680 |
Contraction |
|
0.2 |
1.0 |
0.5619 |
0.5619 |
Contraction |
|
0.3 |
1.0 |
0.5503 |
0.5503 |
Contraction |
|
0.4 |
1.0 |
0.5301 |
0.5301 |
Contraction |
|
0.5 |
1.0 |
0.4956 |
0.4956 |
Contraction |
|
0.6 |
1.0 |
0.4386 |
0.4386 |
Contraction |
|
0.7 |
1.0 |
0.3508 |
0.3508 |
Contraction |
|
0.8 |
1.0 |
0.2303 |
0.2303 |
Contraction |
|
0.9 |
1.0 |
0.0935 |
0.0935 |
Contraction |
|
0.1 |
0.9 |
0.8400 |
0.8400 |
Contraction |
|
0.2 |
0.9 |
0.8322 |
0.8322 |
Contraction |
|
0.3 |
0.9 |
0.8177 |
0.8177 |
Contraction |
|
0.4 |
0.9 |
0.7926 |
0.7926 |
Contraction |
|
0.5 |
0.9 |
0.7495 |
0.7495 |
Contraction |
|
0.6 |
0.9 |
0.6783 |
0.6783 |
Contraction |
|
0.7 |
0.9 |
0.5656 |
0.5656 |
Contraction |
|
0.8 |
0.9 |
0.4095 |
0.4095 |
Contraction |
|
0.9 |
0.9 |
0.2153 |
0.2153 |
Straight |
|
0.1 |
0.8 |
1.1445 |
1.1445 |
Contraction |
|
0.2 |
0.8 |
1.1354 |
1.1354 |
Contraction |
|
0.3 |
0.8 |
1.1182 |
1.1182 |
Contraction |
|
0.4 |
0.8 |
1.0886 |
1.0886 |
Contraction |
|
0.5 |
0.8 |
1.0380 |
1.0380 |
Contraction |
|
0.6 |
0.8 |
0.9540 |
0.9540 |
Contraction |
|
0.7 |
0.8 |
0.8219 |
0.8219 |
Contraction |
|
0.8 |
0.8 |
0.6310 |
0.6310 |
Straight |
|
0.9 |
0.8 |
0.3849 |
0.3849 |
Expansion |
|
0.1 |
0.7 |
1.4612 |
1.4612 |
Contraction |
|
0.2 |
0.7 |
1.4508 |
1.4508 |
Contraction |
|
0.3 |
0.7 |
1.4314 |
1.4314 |
Contraction |
|
0.4 |
0.7 |
1.3977 |
1.3977 |
Contraction |
|
0.5 |
0.7 |
1.3405 |
1.3405 |
Contraction |
|
0.6 |
0.7 |
1.2453 |
1.2453 |
Contraction |
|
0.7 |
0.7 |
1.0949 |
1.0949 |
Straight |
|
0.8 |
0.7 |
0.8744 |
0.8744 |
Expansion |
|
0.9 |
0.7 |
0.5831 |
0.5831 |
Expansion |
|
0.1 |
0.6 |
1.7721 |
1.7721 |
Contraction |
|
0.2 |
0.6 |
1.7606 |
1.7606 |
Contraction |
|
0.3 |
0.6 |
1.7391 |
1.7391 |
Contraction |
|
0.4 |
0.6 |
1.7021 |
1.7021 |
Contraction |
|
0.5 |
0.6 |
1.6390 |
1.6390 |
Contraction |
|
0.6 |
0.6 |
1.5341 |
1.5341 |
Straight |
|
0.7 |
0.6 |
1.3675 |
1.3675 |
Expansion |
|
0.8 |
0.6 |
1.1218 |
1.1218 |
Expansion |
|
0.9 |
0.6 |
0.7916 |
0.7916 |
Expansion |
|
0.1 |
0.5 |
2.0615 |
2.0615 |
Contraction |
|
0.2 |
0.5 |
2.0491 |
2.0491 |
Contraction |
|
0.3 |
0.5 |
2.0260 |
2.0260 |
Contraction |
|
0.4 |
0.5 |
1.9860 |
1.9860 |
Contraction |
|
0.5 |
0.5 |
1.9180 |
1.9180 |
Straight |
|
0.6 |
0.5 |
1.8049 |
1.8049 |
Expansion |
|
0.7 |
0.5 |
1.6244 |
1.6244 |
Expansion |
|
0.8 |
0.5 |
1.3575 |
1.3575 |
Expansion |
|
0.9 |
0.5 |
0.9927 |
0.9927 |
Expansion |
|
0.1 |
0.4 |
2.3163 |
2.3163 |
Contraction |
|
0.2 |
0.4 |
2.3032 |
2.3032 |
Contraction |
|
0.3 |
0.4 |
2.2787 |
2.2787 |
Contraction |
|
0.4 |
0.4 |
2.2363 |
2.2363 |
Straight |
|
0.5 |
0.4 |
2.1643 |
2.1643 |
Expansion |
|
0.6 |
0.4 |
2.0445 |
2.0445 |
Expansion |
|
0.7 |
0.4 |
1.8533 |
1.8533 |
Expansion |
|
0.8 |
0.4 |
1.5683 |
1.5683 |
Expansion |
|
0.9 |
0.4 |
1.1768 |
1.1768 |
Expansion |
|
0.1 |
0.3 |
2.5257 |
2.5257 |
Contraction |
|
0.2 |
0.3 |
2.5120 |
2.5120 |
Contraction |
|
0.3 |
0.3 |
2.4864 |
2.4864 |
Straight |
|
0.4 |
0.3 |
2.4422 |
2.4422 |
Expansion |
|
0.5 |
0.3 |
2.3671 |
2.3671 |
Expansion |
|
0.6 |
0.3 |
2.2420 |
2.2420 |
Expansion |
|
0.7 |
0.3 |
2.0415 |
2.0415 |
Expansion |
|
0.8 |
0.3 |
1.7435 |
1.7435 |
Expansion |
|
0.9 |
0.3 |
1.3318 |
1.3318 |
Expansion |
|
0.1 |
0.2 |
2.6813 |
2.6813 |
Contraction |
|
0.2 |
0.2 |
2.6671 |
2.6671 |
Straight |
|
0.3 |
0.2 |
2.6408 |
2.6408 |
Expansion |
|
0.4 |
0.2 |
2.5953 |
2.5953 |
Expansion |
|
0.5 |
0.2 |
2.5179 |
2.5179 |
Expansion |
|
0.6 |
0.2 |
2.3891 |
2.3891 |
Expansion |
|
0.7 |
0.2 |
2.1831 |
2.1831 |
Expansion |
|
0.8 |
0.2 |
1.8747 |
1.8747 |
Expansion |
|
0.9 |
0.2 |
1.4435 |
1.4435 |
Expansion |
|
0.1 |
0.1 |
2.7770 |
2.7770 |
Straight |
|
0.2 |
0.1 |
2.7626 |
2.7626 |
Expansion |
|
0.3 |
0.1 |
2.7358 |
2.7358 |
Expansion |
|
0.4 |
0.1 |
2.6895 |
2.6895 |
Expansion |
|
0.5 |
0.1 |
2.6108 |
2.6108 |
Expansion |
|
0.6 |
0.1 |
2.4798 |
2.4798 |
Expansion |
|
0.7 |
0.1 |
2.2680 |
2.2680 |
Expansion |
|
0.8 |
0.1 |
1.9557 |
1.9557 |
Expansion |
|
0.9 |
0.1 |
1.5154 |
1.5154 |
Expansion |
Graphical Comparison of Results:

Commentary:
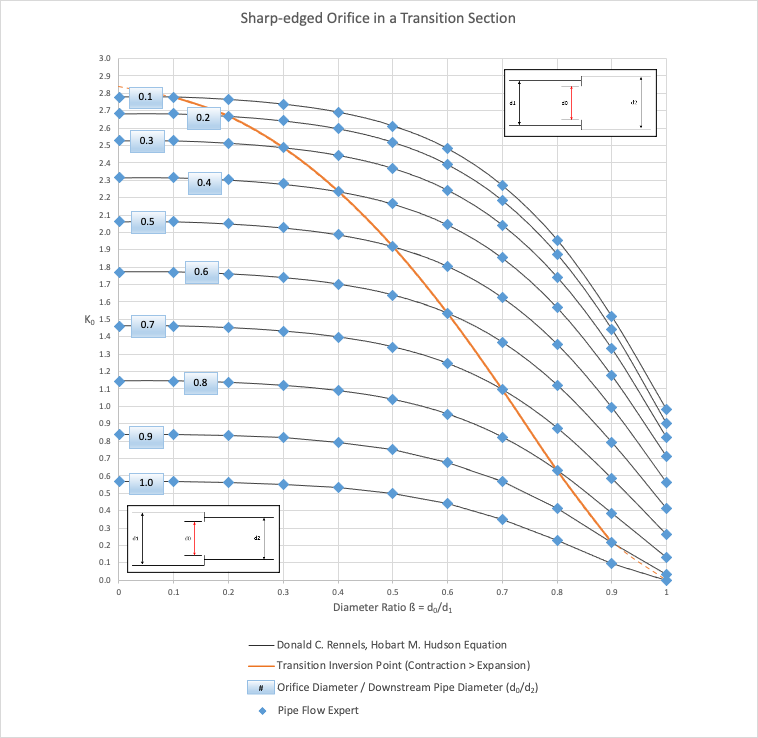
The published k0 loss coefficients compare well with the calculated results.
The transition curve, shown in orange, identifies where the switch point from a contraction to an expansion.
To the left of the transition curve, the internal diameter of the upstream pipe is larger than the diameter of the downstream pipe (these are contractions). To the right of the transition curve the internal diameter of the upstream pipe is smaller than the diameter of the downstream pipe (these are expansions).
Note: Head Loss in m fluid = (k0 * v2) / 2g
- where v = fluid velocity in m/s at the entrance to the orifice, g = acceleration due to gravity in m/s2
- k0 is not the same as a standard k value (which is used in formulas where v = velocity in the pipe)

